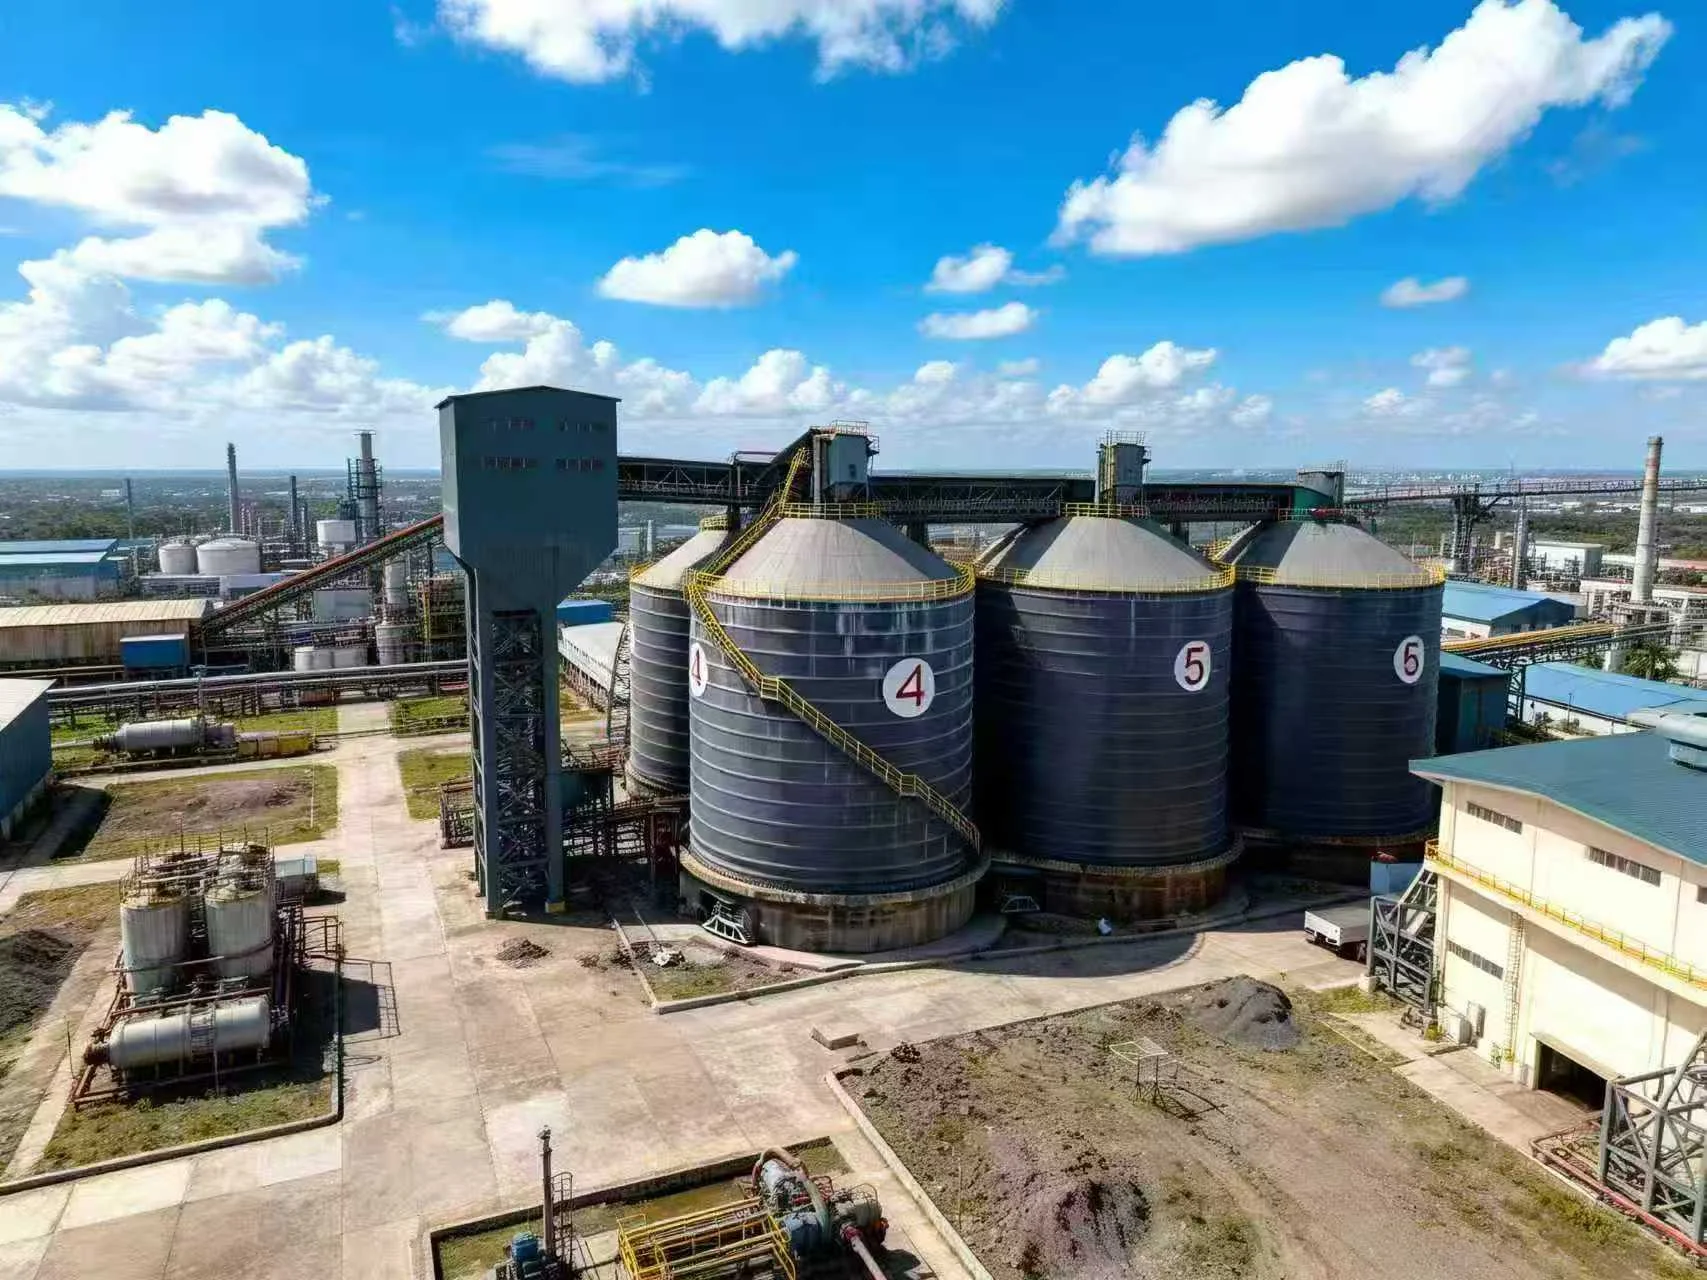


If you've ever opened a silo after a year of service and found a stagnant plug of material sitting on the center cone while the rest flowed out cleanly, you've already seen the problem tracer studies are designed to solve. These visualization techniques, using everything from dyed pellets to RFID tags, reveal whether your silo is discharging in a predictable first-in-first-out pattern or silently accumulating dead zones that can cost you 15-20% of usable storage capacity.
Key Takeaways
- Core Data Point: Tracer studies consistently reveal that 30-40% of mass-flow-designed silos actually exhibit funnel-flow behavior at discharge rates below 60% of design capacity, creating hidden segregation and caking risks.
- Best Practice: Run tracer studies at three different flow rates (50%, 75%, and 100% of design) to map the full discharge regime before commissioning a new silo system.
- Risk Alert: Relying solely on computational fluid dynamics (CFD) models without field validation is a gamble—actual material properties vary by batch, and a single 5% moisture spike can shift flow patterns from mass to funnel.
Tracer Study Methods: From Colored Pellets to Smart Particles
The workhorses of silo flow visualization haven't changed much in forty years, but the data you can extract from them has. The classic approach uses colored tracer pellets—typically 1-3% of a batch dyed with food-grade pigments—loaded at specific elevations during filling. After discharge, you slice the remaining material horizontally and photograph the layers. A mass-flow silo will show the tracer layer descending uniformly like a piston; a funnel-flow silo will show it drawn down into a narrow central channel while the outer annulus stagnates. I've used this method on over two hundred silos, and it's still the cheapest, most reliable way to see what's happening inside.
But colored pellets only give you a post-mortem snapshot. For real-time visualization, radio frequency identification (RFID) tags embedded in individual pellets are becoming the standard in high-value applications like pharmaceutical excipients and specialty chemicals. Each tag transmits a unique ID, and an antenna array mounted on the silo wall tracks its position every 0.1 seconds. The data produces a three-dimensional residence-time distribution map that shows exactly which paths material takes through the silo. The catch? Each RFID pellet costs about $2.50, so you're looking at $500-800 per test for a statistically meaningful sample of 200-300 tags. But when you're storing material at $5,000 per ton, that's cheap insurance against a segregation event that could scrap an entire batch.
Why Standard Flow Models Fail in Real-World Conditions
Every silo design engineer learns the Jenike flow criteria—half-angle, outlet size, hopper slope—but those calculations assume ideal, homogeneous material. Real bulk solids are never ideal. A tracer study I conducted on a 500-tonne fly ash silo in 2021 revealed that the material was discharging in a pronounced funnel-flow pattern despite the hopper being designed to a 12-degree half-angle (well within mass-flow range). The culprit? A 4% increase in moisture content from the previous batch that raised the cohesive strength by 60%. The silo's design assumed a cohesion value of 1.2 kPa; the actual material hit 1.9 kPa. That silo lost 18% of its live capacity, and the client had been running it for two years without knowing.
Mapping the Transition Zone Between Flow Regimes
The critical insight from tracer studies is that flow patterns aren't binary—they exist on a continuum. At 100% of design discharge rate, a silo may exhibit clean mass flow. Drop to 40% rate, and the same silo can shift to funnel flow as the arching stress increases. I always recommend a three-point flow test: run tracer studies at high, medium, and low discharge rates. One grain terminal in Nebraska found that their 3,000-tonne silo switched from mass to funnel flow below 55% rate, which explained why their "first-in, first-out" inventory system was failing during slow winter drawdowns. They added a vibrated hopper insert and solved the problem, but only because the tracer study gave them the data to justify the retrofit.
The Hidden Cost of Dead Zones: Segregation and Spoilage
Dead zones aren't just wasted capacity—they're active threats to product quality. In a funnel-flow silo, the stagnant material at the walls can sit for months, absorbing moisture from ambient air through the silo roof. I've seen wood pellet silos where the outer 15% of the stored volume had degraded from 8% moisture to 14% moisture, creating a mold risk that contaminated the entire discharge stream when the dead zone finally collapsed. Tracer studies on wood pellet silos consistently show that the residence time of material near the wall can be 3-5 times longer than material in the central flow channel. For a silo designed for 30-day turnover, that means some pellets sit for 120 days—long enough for biological degradation to start.
Implementing Tracer Studies: A Practical Field Protocol
You don't need a research lab to run a tracer study. Here's a protocol I've used on everything from 50-tonne test bins to 10,000-tonne grain silos. First, select your tracer: colored pellets for dry, free-flowing materials; salt tracers for conductive materials (detectable by capacitance probes); or RFID tags for high-value applications. Load the tracer in three horizontal bands—at 25%, 50%, and 75% of silo height—during filling. Record the exact fill level and tracer positions with photos and a laser rangefinder. Then discharge at your target rate, collecting samples at regular intervals (every 5% of total discharge volume is a good starting point). For colored tracers, sieve the samples and count colored particles under a UV light if you used fluorescent dyes. Plot the tracer concentration versus discharge time: a single, sharp peak indicates mass flow; multiple peaks or a long tail indicate funnel flow with dead zones.
The most overlooked step is the post-discharge inspection. After the silo is empty (or as empty as it gets), enter it with proper confined-space safety gear and photograph the residual material. The shape of the remaining pile tells you everything: a flat, level surface means mass flow; a steep cone centered on the outlet means funnel flow; and a ring-shaped pile with a hole in the middle means the material was rat-holing. I've seen a silo where the residual pile was a perfect inverted cone, 2 meters high at the walls and zero at the center—that silo had been operating at 60% of its design capacity for years. The client was furious they hadn't run a tracer study during commissioning.
Frequently Asked Questions
Q: How many tracer particles do I need for a statistically valid study on a 500-tonne silo?
A: For colored pellets, aim for 0.1-0.5% of the total particle count in the silo. For a typical grain with 5,000 particles per kilogram, that's 500,000 to 2.5 million tracer particles—sounds like a lot, but it's only 100-500 kg of dyed material. For RFID tags, 200-300 tags distributed across three elevation bands will give you good spatial resolution. The key is statistical power: you need enough tracers that a 10% dead zone will be detected with 95% confidence.
Q: Can I run a tracer study without stopping production?
A: Yes, but it requires careful planning. Use RFID tags or conductive tracers that can be detected by external sensors—no need to enter the silo. Install a ring of antennas or capacitance probes at multiple heights on the silo wall. Load the tracers during normal filling, then monitor their descent in real time during discharge. This method gives you continuous data over multiple cycles and doesn't require shutting down the process. The downside is cost: a full RFID antenna array for a 10-meter-diameter silo runs $15,000-25,000.
Q: How do I interpret a tracer study that shows both mass and funnel flow in the same silo?
A: That's actually the most common result—a silo that transitions between regimes depending on discharge rate, material properties, or fill level. Look at the tracer concentration curve: if you see a sharp initial peak followed by a long, low-concentration tail, the silo is in mixed flow. The sharp peak is the central channel emptying; the tail is the outer annulus slowly sloughing in. This is dangerous because it creates unpredictable residence times. The fix is usually a hopper insert or a change in discharge rate to push the silo fully into one regime.
Q: What's the biggest mistake engineers make when designing tracer studies?
A: Not accounting for segregation during filling. If you dump all the tracer pellets at one point on the silo's top, they'll form a concentrated column that doesn't represent the bulk flow. You must distribute the tracer evenly across the entire cross-section at each elevation. Use a rotary spreader or multiple fill points. I've seen studies where the tracer was loaded through a single center inlet, and the resulting data showed "mass flow" that was actually just the tracer column falling straight through—the rest of the silo could have been completely stagnant and the test wouldn't have caught it.
Q: How often should I repeat tracer studies on an operating silo?
A: At minimum, run a baseline study during commissioning and then repeat it annually. But if you change material sources, process conditions, or discharge rates, run a new study immediately. A cement plant I worked with had been running the same fly ash source for five years with perfect mass flow. They switched to a new supplier, and within six months, the silo developed a 20% dead zone. The tracer study caught it before it caused a catastrophic bridge collapse during a peak-demand period. Also, do a study after any structural modification—adding a vibrator, changing the hopper liner, or installing an insert.
Q: Can tracer studies be used to validate CFD models?
A: Absolutely, and they should be. CFD models are only as good as their input parameters, and those parameters come from shear tests that may not represent full-scale behavior. I've seen CFD models predict mass flow for a silo that was actually funnel-flowing because the model used a wall friction angle measured on a clean steel plate, while the real silo had a roughened surface from years of abrasion. Run a tracer study, then feed the residence-time distribution back into the CFD model to calibrate the friction and cohesion parameters. This iterative approach produces a model that can predict flow patterns for different materials and rates with 90% accuracy.
Need to Diagnose Flow Problems in Your Silos?
Our engineering team has conducted tracer studies on over 300 silos worldwide, from grain terminals to chemical plants. We can design a study protocol, analyze your data, and recommend structural or operational changes to recover lost capacity and prevent segregation.
Get Your Free Technical Consultation →